Trade policy should be a mirror of our national interest, not a window for exploitation.
Tariffs have long been a strategic lever in America’s economic and foreign policy. Yet, in 2025, they have taken on unprecedented weight and visibility. The re-elected Trump administration has revived and sharpened its America First Trade Policy, positioning tariffs as tools of economic nationalism and geopolitical signaling.
This blog explores the policy’s origins, strategic intents, and its current manifestation through official documents and economic data. It dissects how foreign trade partners are responding, how U.S. sectors are adjusting, and what this means for the global trade ecosystem.
How It All Started
The roots of the current tariff escalation can be traced to the January 20, 2025 release of the White House’s America First Trade Policy. This executive communication reframed trade not as a diplomatic art, but as an arena for asserting national sovereignty and economic strength.
The policy statement signaled a return to the “reciprocity doctrine” and made four strategic declarations:
- End American trade concessions deemed unreciprocated.
- Reduce persistent trade deficits, particularly with large emerging economies.
- Strengthen domestic manufacturing by encouraging reshoring.
- Impose retaliatory tariffs in response to discriminatory or exploitative trade practices.
Critics immediately voiced concern over the potential for economic isolation and retaliatory spirals. However, the administration emphasized sovereignty, job protection, and “fair trade” over the efficiencies of liberalized commerce.
Reciprocal Tariffs: A Turn Toward Tit-for-Tat
In February 2025, a pivotal clarification was issued through the White House article on Reciprocal Trade and Tariffs. The article described a new principle: if Country X imposes a 25% duty on U.S. electronics, the U.S. would mirror that same rate on imports from Country X.
This logic marked a departure from WTO-style multilateralism toward a bilateral balancing of accounts. It resembled Cold War-era trade realism, where each move triggered a calibrated countermove.
Notably, the administration claimed this tit-for-tat logic had already:
- Pressured countries like India and Brazil to revisit excessive tariffs.
- Deterred trade diversion tactics by countries previously benefiting from loopholes.
- Led to the renegotiation of multiple bilateral tariff schedules.
Where We Stand: April 2025 Snapshot
According to the Executive Summary Report to the President issued in April 2025, reciprocal tariffs were active against 56 countries. The administration claimed that this had generated:
- $49 billion in new tariff revenue.
- $17 billion in reshored manufacturing investment commitments.
- A reduction of the trade deficit by $28 billion year-over-year.
While independent analysts agree on a reduction in import volumes from targeted countries, others caution that consumer prices, particularly for industrial components and electronics, have risen as a result.
The Data Behind the Drama: Analyzing the Charts
To move beyond political rhetoric and into the realm of empirical evidence, we turned to dataset—a comprehensive compilation of country-level tariff rates, U.S. trade balances, and bilateral policy actions. By examining this data, we gain a clearer picture of the structural shifts in U.S. trade relationships under the America First Trade Policy.
The six visualizations presented below represent more than just numbers—they illustrate the mechanics behind the policy narrative. From the sharp tariff increase against China to the persistent deficits with major trading partners, each chart reveals a different facet of America’s evolving trade stance.
- The alleged tariffs imposed on the U.S. by smaller nations expose asymmetries that, while small in volume, have become symbolic flashpoints in policy discourse.
- The reciprocal tariffs show how the U.S. is systematically applying pressure, even on minor trade partners, to reinforce consistency in bilateral arrangements.
- The updated tariff rates underscore the administration’s use of tariffs not only as economic instruments but as geopolitical signals—most dramatically in the case of China’s 145% rate.
- The trade deficit rankings reinforce long-standing concerns about structural imbalances, particularly with nations like China, the EU, and Mexico.
- On the export side, the charts reveal that the U.S. remains deeply reliant on trade with Canada, Mexico, and the EU—partners that are as vital diplomatically as they are economically.
- Meanwhile, the import dependency charts highlight the complexity of untangling global supply chains, especially when key goods like electronics, and machinery are heavily sourced from deficit-heavy nations.
Together, these six data slices give dimension to what might otherwise be dismissed as protectionist posturing. They reveal a strategy not just to penalize, but to reset terms—across sectors, across borders, and across decades of trade orthodoxy.
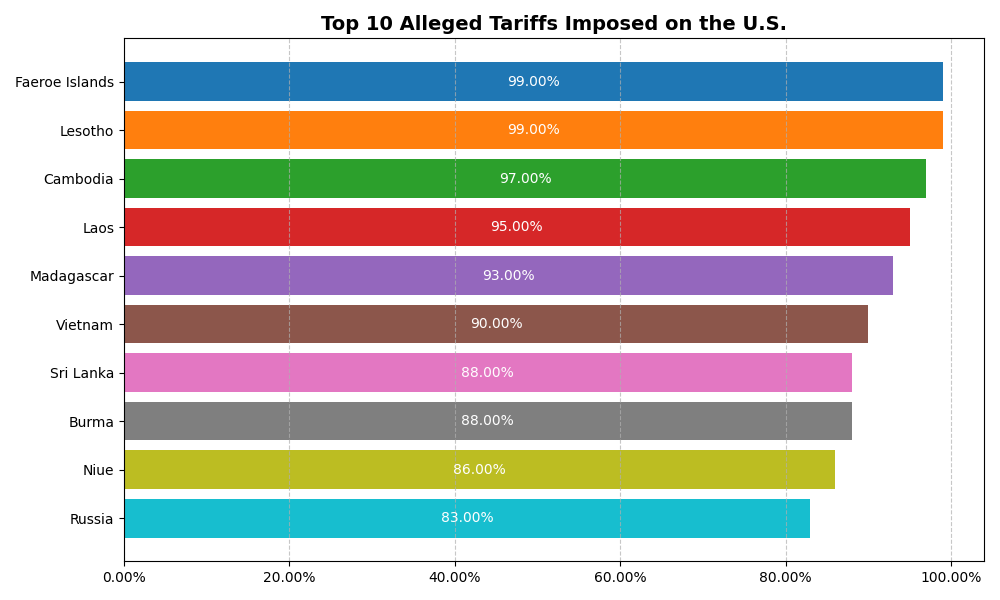
Top 10 Alleged Tariffs Imposed on the U.S. (2025)
This chart highlights the countries applying the highest average tariffs on U.S. exports in 2025. Leading the list are the Faeroe Islands and Lesotho, both imposing tariffs close to 99%. They are followed closely by Cambodia (97%), Laos (95%), and Madagascar (93%). While these countries may not be heavyweights in global trade, their exceptionally high tariff rates—often targeting sectors like textiles, processed foods, and agriculture—stand out as aggressive trade barriers.
The disproportionate tariffs imposed by these smaller economies have become symbolic in the context of U.S. trade rhetoric. Though the trade volumes with these nations are relatively modest, the lack of reciprocity is used by the administration to justify broader retaliatory measures and reassert the principle of fair access. These examples are highlighted not for their economic weight but for what they represent in the wider narrative of trade equity.
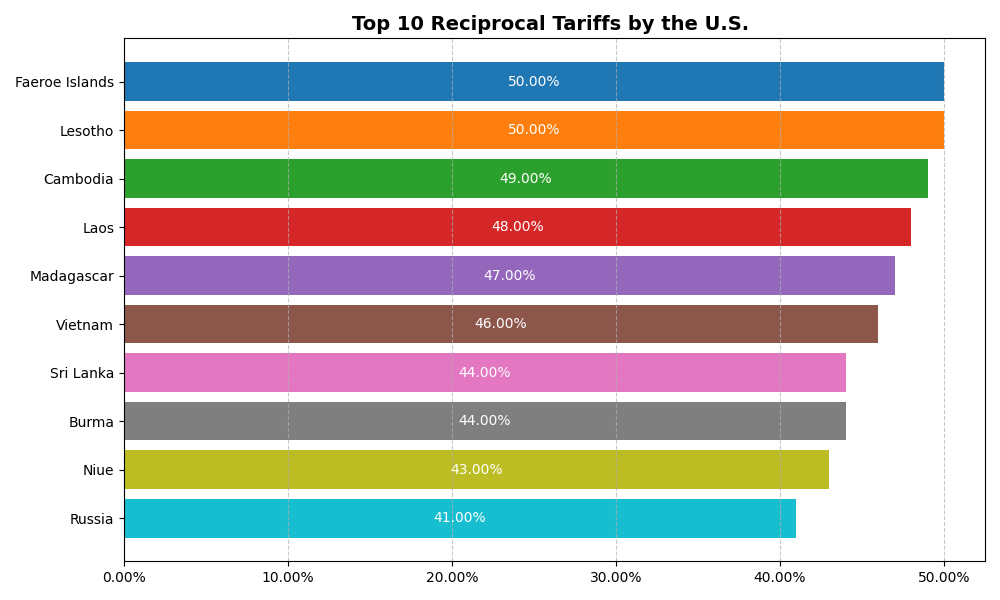
Top 10 Reciprocal Tariffs by the U.S.
In response to the alleged unfair treatment, the Trump administration imposed reciprocal tariffs, some reaching as high as 50%. These were aimed primarily at countries with minimal trade volumes but disproportionately high tariffs on American goods. The strategy was not so much about economic impact as it was about setting precedent: that no country, regardless of size or strategic importance, would be exempt from the U.S.’s demand for parity.
This tit-for-tat approach illustrates the operational philosophy behind the America First Trade Policy—fairness through firmness. By mirroring or matching tariff rates, the administration signaled that even minor abuses would not be overlooked. The goal was to apply pressure broadly and consistently, thereby encouraging renegotiations even with smaller states to build a globally consistent framework.
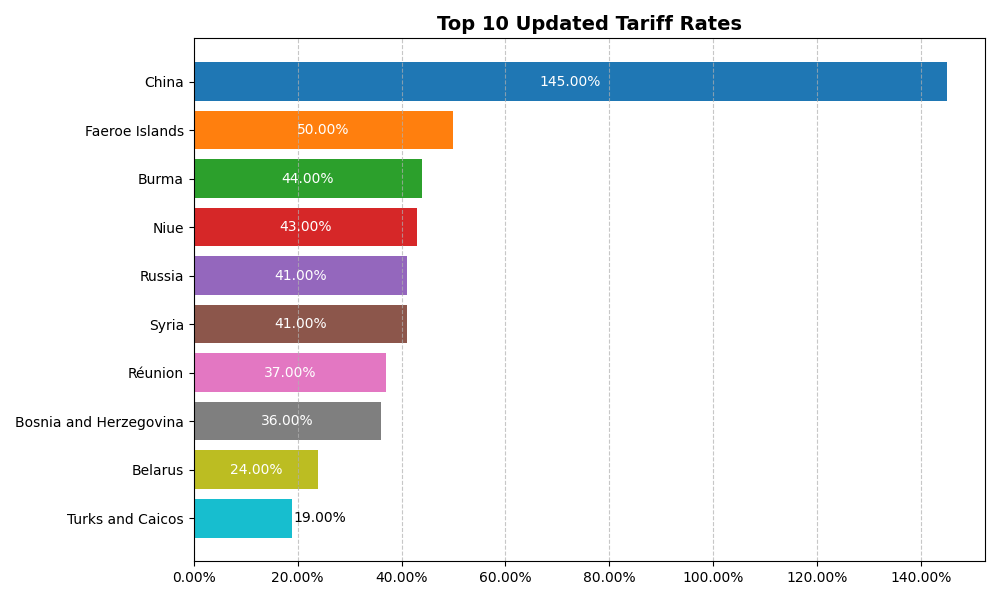
Top 10 Updated Tariff Rates
The April 2025 revisions resulted in a dramatically reshaped tariff landscape. Most notably, China’s tariff was raised to a staggering 145%, a clear response to what the administration has described as chronic and strategic economic threats. Other significant updates include the Faeroe Islands (50%), Burma (44%), Niue (43%), and Russia (41%)—countries identified as either exploitative or uncooperative in previous negotiations.
These updated rates reflect a mix of targeted punishment and systemic harmonization. China’s rate, in particular, stands as a diplomatic and economic statement—it’s not just a tariff, it’s a strategy. The breadth of the update also shows that the administration is intent on standardizing its stance globally, even if it means escalating tensions with multiple partners simultaneously.
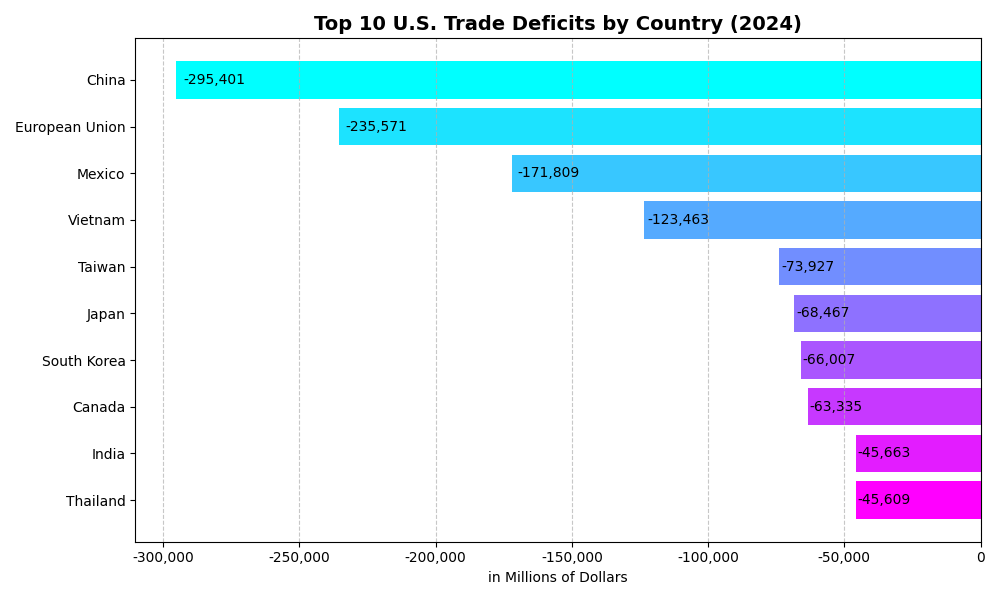
Top 10 U.S. Trade Deficits by Country
The 2024 trade data underscores the depth of America’s trade imbalances, particularly with strategic and economic rivals. China remains the largest source of the U.S. trade deficit, with a staggering negative balance exceeding $295 billion. The European Union and Mexico follow, reflecting deeply entrenched supply chain dependencies. Vietnam, Taiwan, and Japan round out the top deficit contributors—each playing a pivotal role in U.S. imports of semiconductors, electronics, and industrial components.
These figures reinforce the central claim of the America First Trade Policy: that the United States has, for decades, accepted unequal trading terms. The magnitude of these deficits strengthens the administration’s justification for aggressive tariff policies and renegotiation of trade agreements. It also raises questions about whether trade liberalization has been matched by reciprocity from key partners.
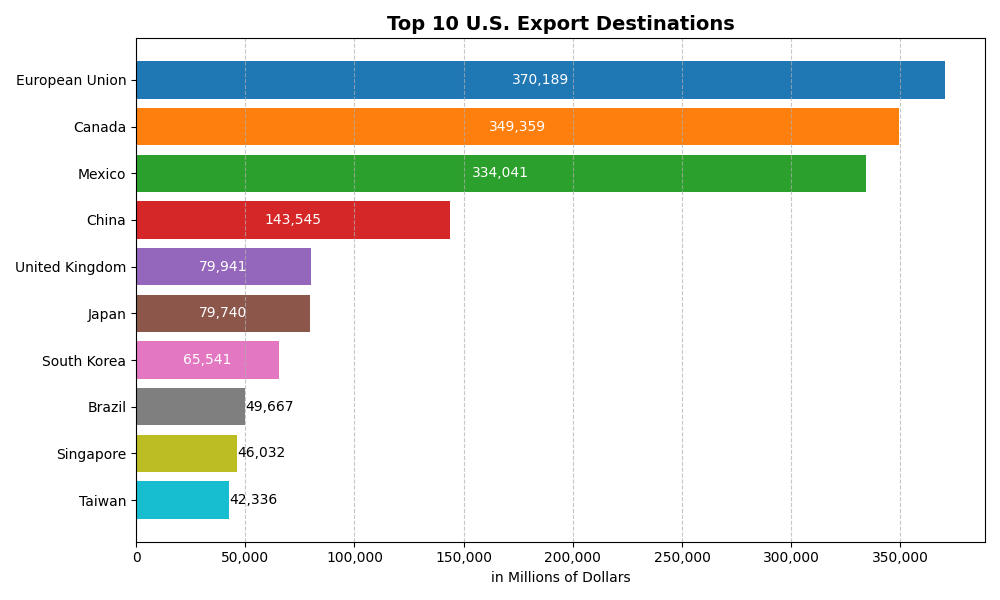
Top 10 U.S. Export Destinations (2024)
U.S. export strength remains anchored in its nearest allies and long-standing trade partners. The European Union, Canada, and Mexico lead as the top three destinations for American goods, each with volumes surpassing $300 billion in 2024. China and the United Kingdom close out the top five—testament to their economic significance despite increasing tensions with Beijing.
These markets represent more than trade—they are pillars of American geopolitical influence. Escalating tariffs against a partner like China, while justified from a deficit standpoint, carries real risks given China’s simultaneous role as a top U.S. export market. In contrast, maintaining strong trade relations with Canada and the EU is not only economically advantageous but diplomatically essential.
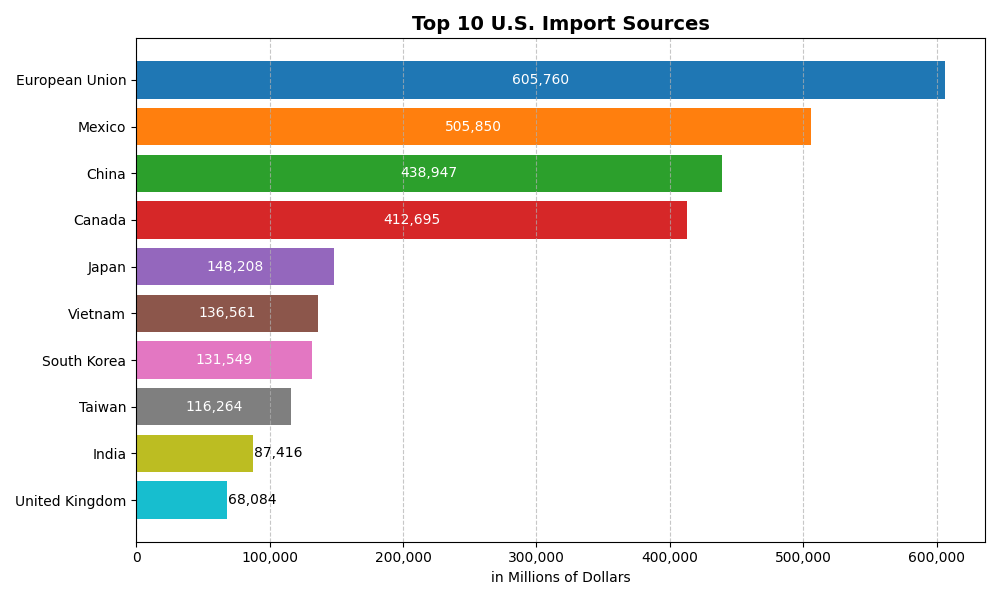
Top 10 U.S. Import Sources
The 2024 import data shows a clear picture of American reliance on a handful of strategic suppliers. The European Union, Mexico, and China top the list, with China alone responsible for nearly $439 billion in U.S. imports. This includes high-volume flows of electronics, consumer goods, and industrial inputs. Japan, South Korea, and Vietnam also rank highly, underlining the globalized nature of American supply chains.
Despite increased tariffs and tougher trade rhetoric, U.S. import dependence on adversarial or complex partners remains strong. This suggests that tariffs alone are insufficient to drive decoupling or reshoring. Achieving structural change will require broader strategies—investment in domestic manufacturing, incentives for supply chain relocation, and stronger regional trade compacts.
Foreign Trade Barriers: The NTE Report’s Global Reality Check
According to the 2025 National Trade Estimate Report on Foreign Trade Barriers (USTR, March 2025), U.S. exporters face significant obstacles in over 60 markets.
Key NTE Highlights:
- India: High import duties on medical devices and agri-products; frequent customs delays.
- Brazil: Complex licensing rules, high VAT regimes, and preference for local suppliers in public procurement.
- China: Persistent issues with IP enforcement, licensing opacity, and state subsidies distorting market access.
- EU: Regulatory barriers and digital services taxes continue to challenge U.S. tech and media exports.
These barriers, in many cases, are not addressed by existing WTO mechanisms—leading to increased reliance on bilateral measures like reciprocal tariffs.
Conclusion: A New Global Trade Normal?
The America First Trade Policy is more than rhetoric, it’s a fundamental reshaping of U.S. trade posture. Tariffs are now tools of negotiation, retaliation, and industrial policy. Yet, the road ahead is complex:
- Economic Efficiency vs. Sovereignty: Can America protect key sectors without compromising price stability?
- Global Response: Will other nations adopt similar tit-for-tat models, or seek multilateral remedies?
- Long-Term Vision: Is this a transition to decoupling or a recalibration of global trade norms?
In 2025, tariffs are no longer mere taxes—they are strategic instruments. As policies unfold, the key will be in balancing assertiveness with adaptability.
Disclaimer
The insights and interpretations presented in this blog post are based entirely on data analysis and do not reflect any political endorsement or opposition toward the America First Trade Policy, the United States government, or any foreign government. This work is intended purely for informational and educational purposes, aiming to encourage data-literate dialogue about evolving trade dynamics.
To construct this analysis, data was drawn from multiple sources including the 2025 National Trade Estimate Report on Foreign Trade Barriers, official U.S. policy communications, and the “Tariff Calculations plus Population” dataset. Supplementary data was referenced from external datasets such as U.S. tariff listings, global population figures, and archival records of adjusted tariff rates. While reviewing and reconciling these sources, minor discrepancies were identified—particularly in country naming conventions and reported percentages. These inconsistencies were addressed and adjusted for consistency, without materially affecting the substance or direction of the analysis.
This blog post does not constitute economic or trade policy advice. It is a reflection on global trade patterns as informed by publicly available data and should be interpreted as such.
References
- White House. (2025, January). America First Trade Policy. Retrieved from: https://www.whitehouse.gov/presidential-actions/2025/01/america-first-trade-policy/
- White House. (2025, February). Reciprocal Trade and Tariffs. Retrieved from: https://www.whitehouse.gov/articles/2025/02/reciprocal-trade-and-tariffs/
- White House. (2025, April). Report to the President on the America First Trade Policy: Executive Summary. Retrieved from: https://www.whitehouse.gov/fact-sheets/2025/04/report-to-the-president-on-the-america-first-trade-policy-executive-summary/
- Office of the U.S. Trade Representative. (2025). National Trade Estimate Report on Foreign Trade Barriers. Retrieved from: https://ustr.gov
- Kaggle. (2025). U.S. Tariffs 2025 Dataset. Retrieved from: https://www.kaggle.com/datasets/danielcalvoglez/us-tariffs-2025/data
- Worldometer. (2025). World Population by Country. Retrieved from: https://www.worldometers.info/world-population/population-by-country/
- BBC News. (2025). Trump Tariffs List by Country. Retrieved from: https://www.bbc.com/news/articles/c5ypxnnyg7jo
- White House. (2025). Annex I: Adjusted Tariff Rates (Archived). Retrieved from: https://web.archive.org/web/20250403002213/https://www.whitehouse.gov/wp-content/uploads/2025/04/Annex-I.pdf